Multiband, multispectral and hyperspectral imaging can carry a range of definitions depending on the project and application. These techniques presented on this website are defined here, along with reflectance imaging spectroscopy, to clarify the differences between them. Multispectral and hyperspectral imaging are both types of reflectance imaging spectroscopy, which Ricciardi et al. (2013, 13) define as the "collection of images at many different wavelengths to obtain reflectance spectra over a large spatial area." Reflectance refers to the light reflected or scattered by a material relative to the incident light, and reflectance spectra is a curve illustrating the amount of reflectance at each wavelength over a defined spectral range (Fischer and Kakoulli 2006). Ricciardi et al. (2013) define multispectral imaging in the context of reflectance imaging spectroscopy as the acquisition of calibrated images with bandwidths of tens to hundreds of nanometers and hyperspectral as the collection of images with bandwidths of a few nanometers or less. Multiband imaging is similar to these techniques, however it refers to the acquisition of uncalibrated images with bandwidths of 100's nm that are captured using a modified digital SLR camera and bandpass filters. Similar to hyperspectral and multispectral imaging, multiband imaging captures characteristic spectral information about objects, however the uncalibrated image sets cannot produce reflectance spectra.

Multiband & Multispectral Imaging
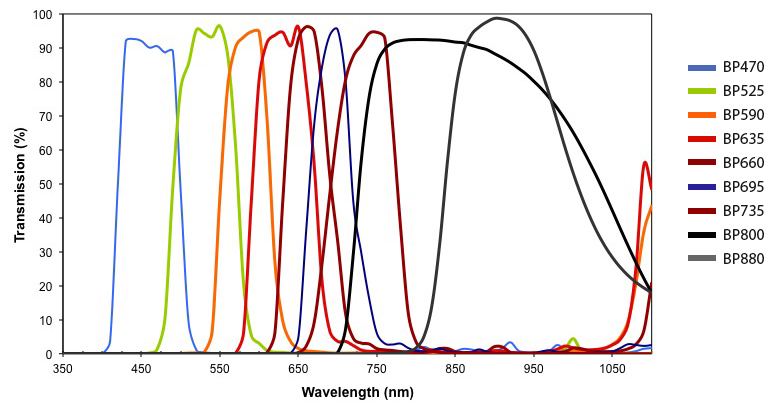
For multiband imaging, we use a modified DSLR. Most DSLRs have IR-cut filters on the sensors that increase the quality of the visible light image by blocking any infrared radiation from the sensor. The modification of the camera we use included the removal of the IR-cut filter and the color filter array (CFA) allowing the camera to have a maximum sensitive of around 330nm to 1200nm and to acquire monochrome images.¹ The spatial resolution of this camera, 5616 x 3744 pixels, allows an entire object to be captured at a fairly high resolution in a single image. Generally the camera is mounted on a studio stand and the filters are changed manually, without changing the focus or position of the camera. Movement of the camera or focus while changing the filters manually could affect the alignment of the images. A filter wheel could be useful to avoid these small shifts, however this increases setup costs and manual changing has been adequate so far. Nine filters are used, producing nine monochrome images for each filter. The transmission curve for the filters can be seen below.
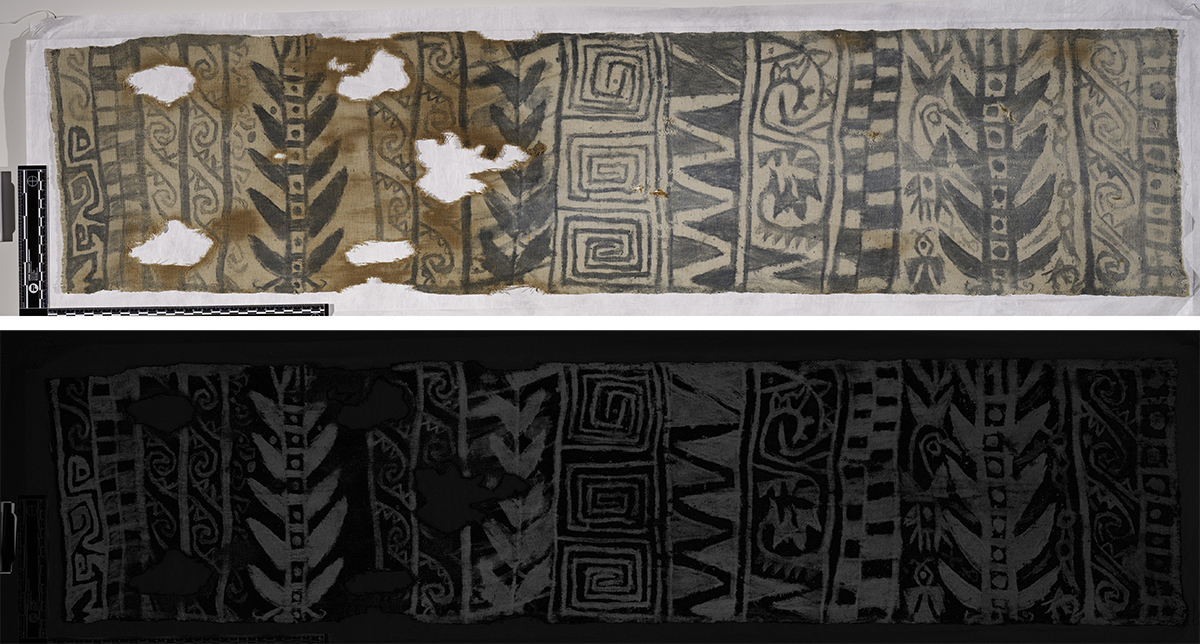
Each monochrome image records the interaction of light (reflection and absorption) with the material of the textile and pigment at the specific bandwidth of the filter. The variation of the interaction of the light with the different bandwidths can reveal and distinguish materials. Image subtraction with image processing software such as Adobe Photoshop or ImageJ can be used to process images to better reveal some of the pigments used. Image subtraction is a simple, powerful process that can be applied for visualizing the difference or changes between two images (Jain 1986). The pixel values of two images are subtracted resulting in an image that reveals the differences between the pixel values of two images.
The same camera, lighting and filters can be used for multispectral imaging. MCI will need to incorporate additional steps for the proper acquisition and calibration of images and a software solution for visualization and analysis.
¹Information from http://maxmax.com/IRCameraConversions.htm.
Click here to learn more about the multiband and hyperspectral imaging of archaeological Peruvian painted textiles.
Hyperspectral Imaging
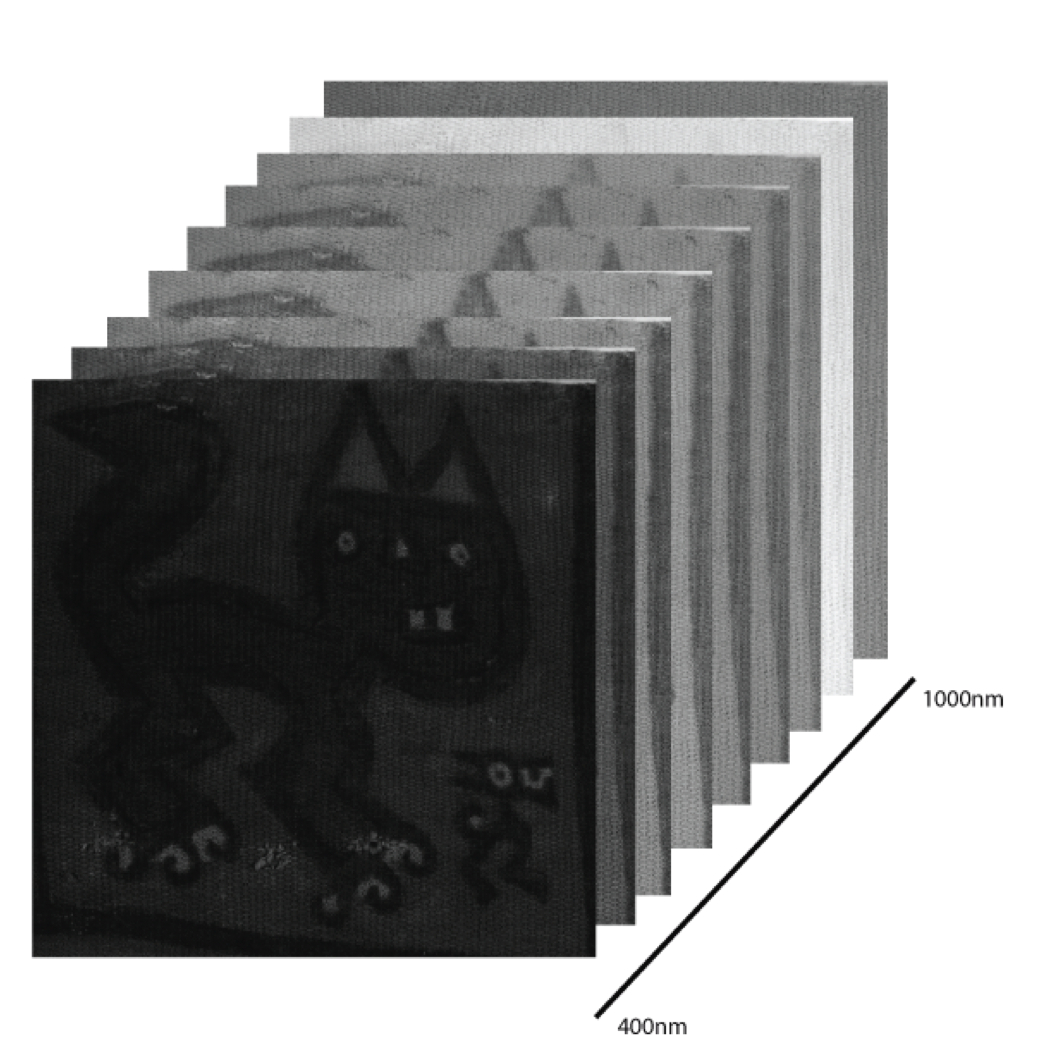
As stated above, hyperspectral imaging is a reflectance imaging spectroscopy technique that involves collecting images with bandwiths of a few nanometers or less. The system used at MCI utilizes a CCD censor and has a spectral sensitivity from 400-1000nm. The camera acquires 128 images between 400nm to 1000nm creating a data cube that can provide reflectance spectra for pixels or areas of interest, as well as images of the area analyzed at a particular wavelength. The reflectance spectra helps researchers, conservators and scientist with material identification.
Smithsonian Grand Challenge Grant
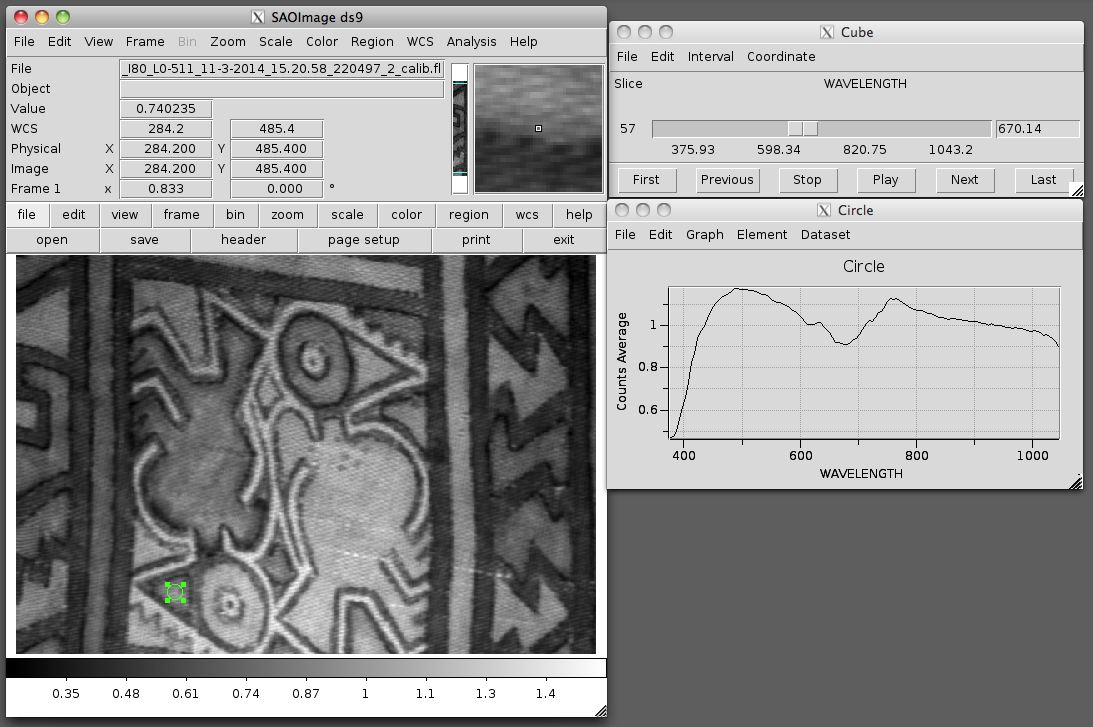
The Smithsonian Astrophysical Observatory (SAO) and MCI received a 2013 Smithsonian Grand Challenge Level One Grant from the Consortium for Unlocking the Mysteries of the Universe to fund Adapting SAOImage DS9 for General Purpose Hyperspectral Imaging. Members of SAO have developed extensive expertise in the visualization and analysis of complex astrophysical datasets. SAOImage DS9 is a software application developed at SAO specifically for this task and is widely used world wide by the astrophysical community. In particular, SAOImage DS9 has enhanced support for the visualization of large complex 3D datasets without the need for advanced or specialized computer hardware.
With the availability of low cost hyperspectral cameras, hyperspectral imaging is starting to be used as a nondestructive technique that can help with material identification in cultural heritage objects. The complex 3D datasets that are generated through hyperspectral imaging are similar in form, if not in content, to the astrophysical datasets studied at SAO.
To fully exploit the information obtained by the hyperspectral imaging camera at MCI requires a sophisticated visualization and analysis software package. The work between SAO and MCI involves investigating the possibility of adapting SAOImage DS9 to support general purpose hyperspectral visualization and analysis. Bill Joye (SAO developer) and E. Keats Webb are working closely to determine the requirements for visualization and analysis, to identify which of these functions already exist within SAOImage DS9, and to determine the effort required to provide MCI (and others with similar needs) the full functionality that is required.
MSI & HSI Resources
Aalderink, B.J., Klein, M.E., Padoan, R., Bruin G., & Steemers, T.A.G. (May 2009). Clearing the Image: A Quantitative Analysis of Historical Documents Using Hyperspectral Measurements. Poster presented at the Book and Paper Group of the AIC 37th Annual Meeting, Los Angeles, CA.
BK100-xx Filter KitBandpass Filters. MidOpt Filter Kit.
Delaney, J. K., E. Walmsley, B. H. Berrie, and C.F. Fletcher. 2005. Multispectral Imaging of Paintings in the Infrared to Detect and Map Blue Pigments. Proceedings of the National Academy of Sciences Scientific Examination of Art: Modern Techniques in Conservation and Analysis Washington, DC March 2003, 120-136.
Dyer, Joanne, Giovanni Verri, and John Cupitt. "Multispectral Imaging in Reflectance and Photo-induced Luminescence Modes: A User Manual.". The British Museum. The British Musem, Oct. 2013. Web. 25 June 2014.
Warda, Jeffrey, Franziska Frey, Dawn Heller, Dan Kushel, Timothy Vitale, and Gawain Weaver. The AIC Guide to Digital Photography and Conservation Documentation. 2nd ed. Washington: American Institute for Conservation of Historic and Artistic Works, 2011. Print.
Fischer, C., and I. Kakoulli. "Multispectral and hyperspectral imaging technologies in conservation: current research and potential applications," Reviews in Conservation 7 (2006): 3-16.
Jain, A. K. 1986. Fundamentals of Digital Image Processing. Edgewood Cliffs, NJ: Prentice Hall.
Ricciardi, P., J.K. Delaney, M. Facini, and L. Glinsman. 2013. "Use of Imaging Spectroscopy and in situ analytical methods for the characterization of the materials and techniques of 15th century illuminated manuscripts." Journal of the American Institute for Conservation 52(1): 13-29.
Ricciardi, P., J.K. Delaney, L. Glinsman, M. Thoury, M. Facini, and E.R. de la Rie. 2009. "Use of visible and infrared reflectance and luminescence imaging spectroscopy to study illuminated manuscripts: pigment identification and visualization of underdrawings." Proceedings of O3A: Optics for Arts, Architecture, and Archaeology II: 7391(July 2, 2009): 739106-1-12.